
See our latest attribution article: Understanding Attribution: The Markov Model
The challenge of reporting on different Attribution Models
Most marketeers are aware of what an attribution model is, what the different attribution model types are (last interaction, first interaction, last non-direct click, time decay, position based, data-driven, etc.) and what insights different attribution models can give to businesses. However, when it comes to reporting, changing the attribution model from the last iteration to any other model can be seriously challenging.
In this post we review a variety of different attribution models that are easily available within the most popular digital marketing platforms.
Google Adwords – Search Attribution
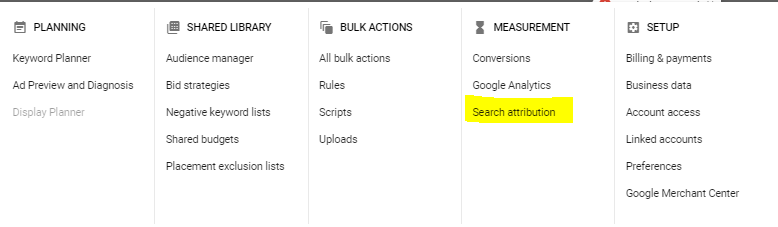
From a paid search perspective, Google Ads offers a solution whereby you can compare different attribution models.
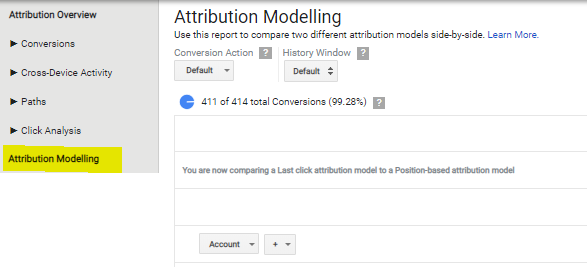
With this tool you can compare how different attribution models affect conversions by campaigns, ad groups, keywords, match types and devices. For example, if someone clicks on a Generic keyword, doesn’t convert, but then clicks on a Brand keyword and converts:
First Click Attribution: conversion would be assigned to the Generic keyword.
Last Click Attribution: conversion would be assigned to the Brand keyword.
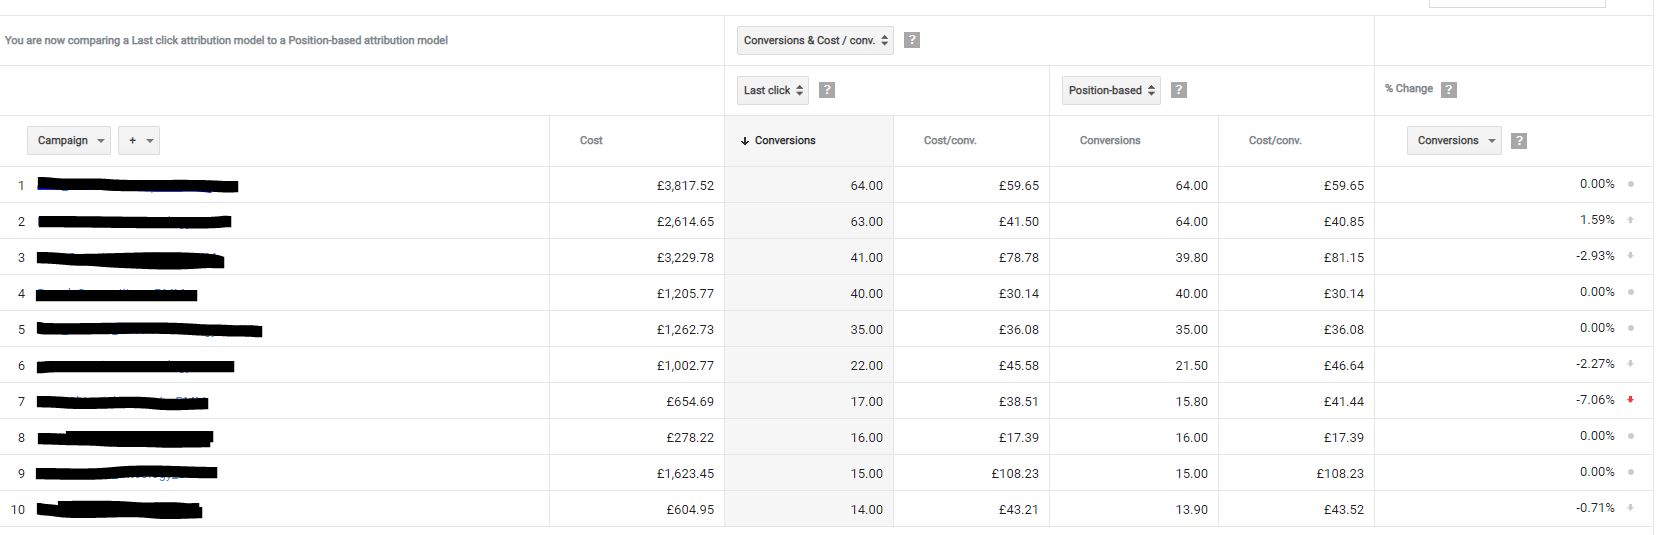
In both cases, the total conversions will be 1. The total conversions will always be the same on an account level, independent of the attribution model, as you can see in the screenshot below. This is because the only thing that changes is the campaign that the conversion will be attributed to.
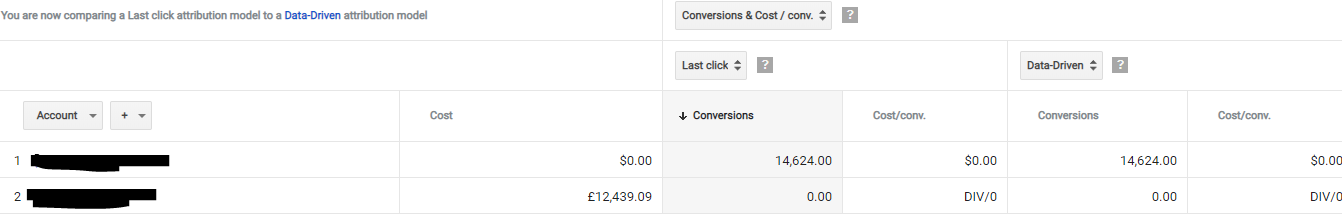
The same applies when you change the attribution model when creating a new conversion.
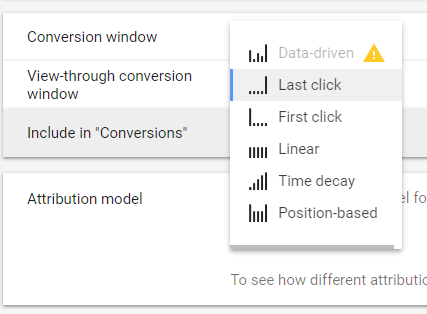
It’s important to keep in mind that the Google Ads attribution model only applies to Google Paid Search as it’s not a multi-channel tool.
If you are trying to understand the full user journey and a multi-channel analysis, Google Ads Attribution Modelling is not the right tool.
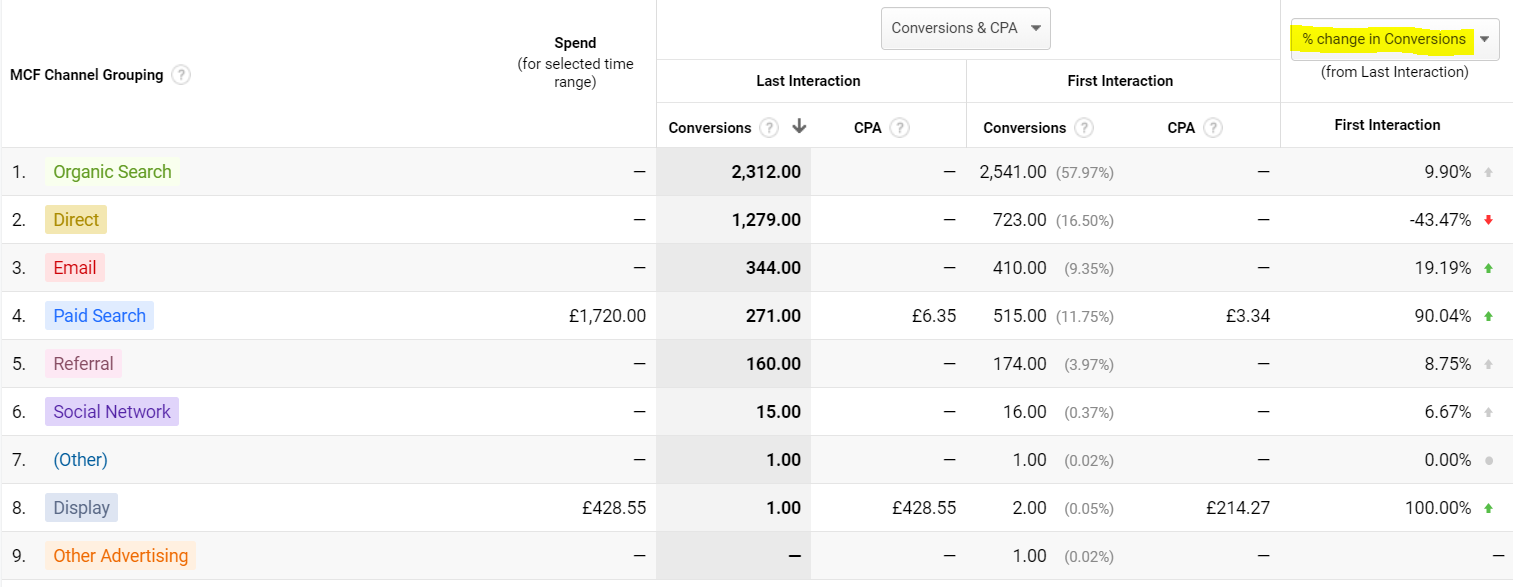
With the Google Analytics Model Comparison tool, the total conversions by source/medium will change based on the attribution model that you choose since it takes into consideration the whole user journey. In other words, all the channels that the user interacted with could potentially receive a conversion based on the attribution model chosen.
Facebook
Facebook’s standard attribution model is different from Google Analytics and Google Ads. Facebook considers a conversions if your ads are clicked or viewed (28 day click windows and 1 day view windows).
So, let’s say you are advertising shoes on Facebook and someone sees your ad but doesn’t click on it. If after 3 hours the person searches for shoes on Google, clicks on your Paid Search ad and buys any item, Facebook will count that as a conversion and Google Ads as well (because of GA’s standard last interaction attribution model).
The problem with Facebook’s standard attribution is that if you are reporting on the platform’s conversions you might be double counting conversions, as per example above.
It is possible to change the attribution model to click only and change the attribution window on the Settings. However, the most consistent way of reporting conversions from different source/mediums is by using a multi-channel platform such as Google Analytics.

Facebook Attribution Tool
Facebook recently released Facebook Attribution which is an attribution tool that promises to give a more complete picture of customer journeys.
To set up the Facebook Attribution tool you just need to have the Facebook pixel or Facebook SDK for app events installed and if you’ve already been using UTM parameters with your ads, no additional setup is required.
The attribution models available are similar to the Google Analytics Model Comparison Tool but slightly different. The available models are:
Even credit – The even credit attribution model gives an equal percentage of the credit for a conversion to each touchpoint on a conversion path.
Last click or visit – The last click or visit attribution model gives 100% credit to the last click or visit that happened in a conversion path.
Last touch – The last touch attribution model gives 100% of the credit for a conversion to the last click or visit that happened in a conversion path. If there was no click or visit, then it will credit the last impression.
Positional (30% or 40%) – The positional attribution model gives a specific percentage of the credit for a conversion to the first and last touchpoints in a conversion path, with the remaining credit distributed evenly across all other touchpoints.
Time decay (1-day or 7-day) – The time decay attribution model gives an increasing percentage of the credit for a conversion to touchpoints as they get closer in time to the conversion.
The tool also offers a list of 17 other attribution windows, with varying click and visit time periods.
The Facebook Attribution tool is brand new (it came out in October 2018) and on first impression it seems there is a lot to be improved:
- The tool is still very limited.
- There isn’t an option of comparing different attribution models, you need to do one at a time.
- It’s not possible to export custom reports, so they’re just available on the Facebook interface.
- The data is available from the day you create your line of business, or, in other words, from when you start using Facebook Attribution. This means you will have to wait until you have enough data to analyse the attribution reports.
- It is possible to add impressions and clicks from other platforms (Google Ads, Bing, Criteo, LinkedIn, etc.) so you can see the complete user journey in one place. However, in order to have this data available you need to install one tag for each platform.
You can find more information about how to start using Facebook Attribution here.
Google Analytics – Model Comparison Tool
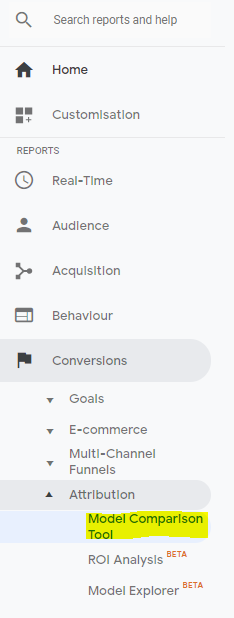
Google Analytics offer a free multi-channel Attribution Model Comparison called ‘Model Comparison Tool’ that can be found under Conversions > Attribution > Model Comparison Tool on the main menu.
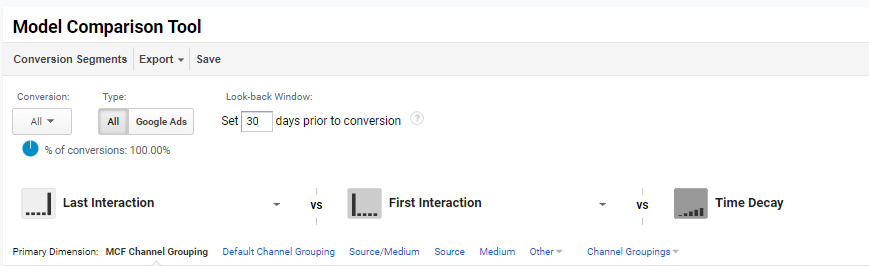
This report gives the possibility of comparing 3 different attribution models and understanding how conversions can be higher or lower on different attribution models across different source/mediums. This is a great feature and can provide an overall idea of performance.
With this report you can see different attributions models by campaign, conversion type (you need to filter in the conversion box) and source/medium. You can even change the Look-back window based on what is relevant to your business.
But now, imagine that you want to export this comparison by day, campaign, keyword, conversion type and source/medium to include in your weekly report.
The Model Comparison Tool reports are quite limited and it’s not the best way to analyse on a more granular level of detail as it’s not possible to download a report with all the above segments. The good news is that GA offers an API with more segments options.
Multi-Channel Funnels Reporting API
Some of the common dimensions that can be easily exported and included in your reports using the API are:
- Day
- Goal number
- Source/Medium
- Campaign
- Keyword
All the available dimensions that can be included in the reports are listed here.
Automated reports using a different Attribution model
Automated solutions such as Supermetrics can simplify the reporting process and save you hours of work on a weekly basis. Supermetrics integrates the main channels such as Facebook, Google Analytics, Google Ads, Bing, LinkedIn and other marketing platforms in a friendly and familiar (Google Sheets sidebar) interface.
It’s important to highlight that some of the automated solutions, such as Data Studio can’t report on different attribution models when pulling the data directly from Analytics. This is because the connector that collects the data from the platforms uses the standard last click attribution. However, it is still possible to use Data Studio reports by changing the data source from Analytics to a Google spreadsheet (with the data pulled from Google Analytics API).
Conclusion
Attribution Modelling is a complex field that is rapidly growing in importance, there are currently many different solutions of varying quality, but it seems that none of them are quite ‘perfect’.
However, considering all the attribution model tools presented above, Google Analytics (API) is the most holistic solution if you are searching for a more granular level of detail. It takes into consideration the whole user journey and the reporting solution is very complete.
In conjunction with reporting automation tools, reporting on different attribution models becomes even easier and faster. It may not be the holy-grail of attribution – but for now it’s the closest thing we’ve got!
Read our blog on Data Driven Attribution.
Have a look at our Analytics and Attribution Services.