News
Google Search Console ‘Platform Properties’: What the New Social & Video Reporting Means for Brands

Social Search
Digital PR is booming, but what is Digital PR? And why you can’t ignore it in the age of AI

Digital PR

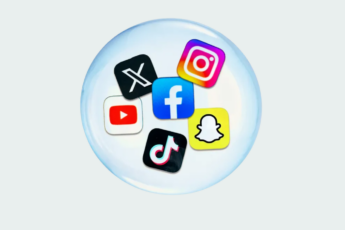
Under-16s banned from social media: What does this mean for your content marketing strategy?
Industry Updates
July 2026: The Future of Full-Funnel Marketing

Events
ROAST Celebrates Double Recognition in Media Week 30 Under 30 2026
Agency News
ROAST Appoints Nicole Palmieri as Head of Digital PR to a Lead AI-First Generative Engine Optimisation (GEO) Offering
Agency News

From Athens SEO: What’s Next for Organic Growth?

SEO
Organic Discoverability Framework: Connecting SEO, GEO, Content & Digital PR

AI
ROAST named in Campaign’s Best Places to Work 2026
Agency News

OpenAI Ads Manager Explained: Hands-On Testing of ChatGPT Advertising

PPC

Marketing Measurement in 2026: The Fundamentals that Actually Matter

Data & Analytics
Why your Google traffic is dropping (and what’s replacing it)
AI